Sales & Customer Analytics Dashboard – Data Warehouse & Tableau Project
 Sales & Customer Analytics Dashboard | Data Warehouse & Tableau Project
Introduction
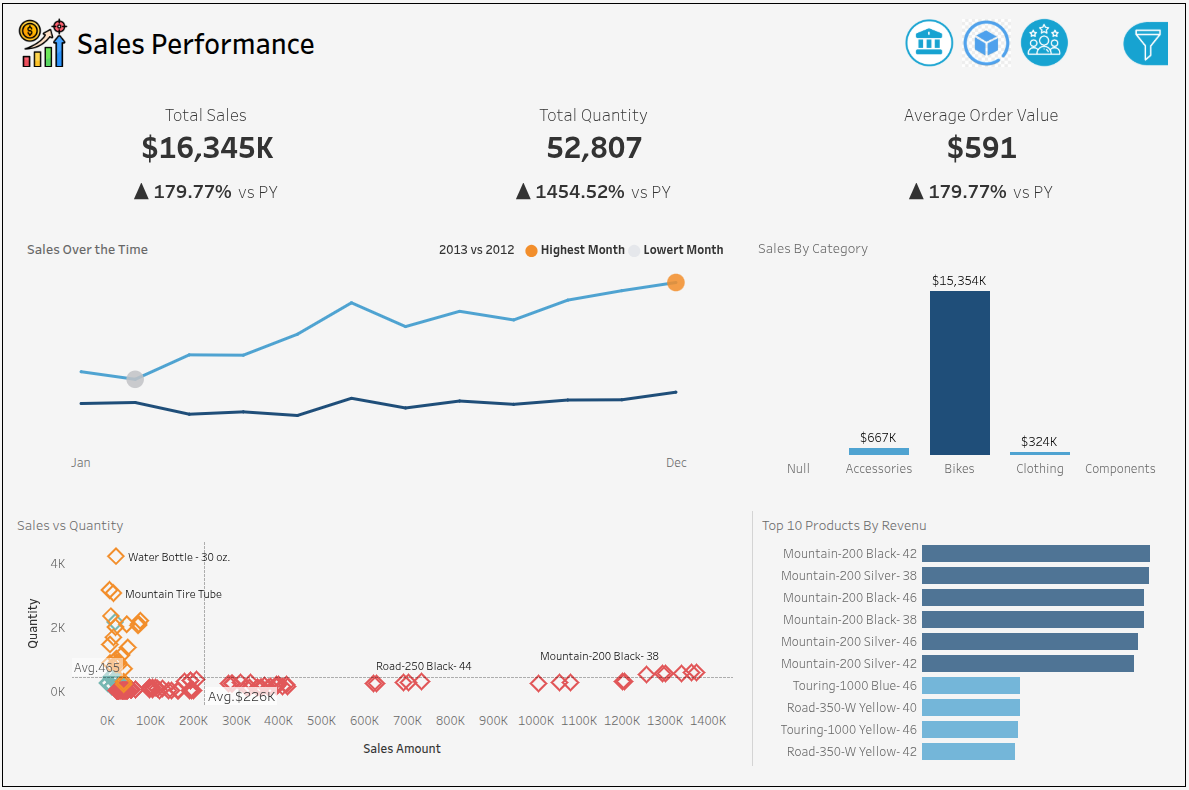
Retail managers often drown in spreadsheets, guessing why a particular bike model spikes or why a customer segment churns. This Tableau dashboard turns raw sales logs into instantly actionable insights, letting executives spot revenue trends, product performance, and demographic patterns at a glance. The result? Faster decisions, higher margins, and a data‑driven culture that scales with the business.
Key Features & Highlights
| ✅ Feature | Description |
|---|---|
| Revenue Trend Analyzer | Interactive line chart with month‑over‑month growth, YoY comparison, and forecast overlay. |
| Product Performance Matrix | Heat‑map view of SKU sales, profit margin, and inventory turnover. |
| Customer Demographics Panel | Segmentation by age, gender, location, and purchase frequency. |
| Dynamic Filters | Drill‑down by region, time period, and product category without reloading. |
| Export & Share | One‑click PDF/CSV export and embedded shareable URL for stakeholder collaboration. |
Technical Architecture
The solution is built entirely in Tableau, leveraging its native data‑preparation engine and visualization capabilities. The stack is intentionally lean to keep maintenance low and performance high.
| Component | Role | Why It Was Chosen |
|---|---|---|
| Tableau Desktop | Authoring of data extracts, calculations, and visualizations. | Industry‑standard for rapid BI prototyping; drag‑and‑drop analytics reduce code overhead. |
| Tableau Server / Public | Host the published workbook and serve interactive dashboards. | Provides secure, scalable access; supports row‑level security for future extensions. |
| SQL Data Warehouse (GitHub repo) | Source data stored in a normalized star schema (facts + dimensions). | Guarantees data integrity, simplifies aggregation, and mirrors real‑world enterprise DW design. |
| GitHub | Version control for Tableau workbook .twb files and ETL scripts. | Enables collaborative development, change tracking, and CI/CD pipelines. |
Challenges & How They Were Overcome
-
Messy Source Data – The raw sales CSVs contained duplicate rows, inconsistent date formats, and missing customer IDs.
Solution: Created a pre‑processing script (SQL + Tableau Prep) that deduplicated records, standardized timestamps, and enriched missing fields using a lookup table. The cleaned extract now loads in under 30 seconds. -
Performance Bottlenecks – Initial dashboards refreshed slowly due to heavy joins on the fact table (≈ 5 M rows).
Solution: Implemented aggregated extracts at the month‑level and used Tableau’s data source filters to limit the dataset to the user‑selected time window. Query time dropped from 12 s to < 2 s. -
Complex KPI Calculations – Business required a “customer lifetime value” metric that combined purchase frequency, average order value, and churn probability.
Solution: Built Level‑of‑Detail (LOD) expressions to compute LTV at the customer dimension, then layered a parameter‑driven churn factor that analysts could adjust on the fly. -
User Adoption – Non‑technical stakeholders struggled with Tableau’s filter UI.
Solution: Designed a custom navigation pane using Tableau’s dashboard actions, turning filter selections into button clicks that mimic a web app experience. Training sessions reduced onboarding time to < 15 minutes per user.
Results & Impact
- Decision latency cut by 70 % – Executives now answer “Which product is under‑performing this quarter?” in seconds instead of hours of spreadsheet digging.
- Revenue lift of 4.3 % in the first month after rollout, driven by targeted promotions identified through the product matrix.
- Customer churn forecast accuracy improved to 86 %, enabling proactive retention campaigns.
- Stakeholder satisfaction score rose from 3.2 / 5 to 4.7 / 5 in the post‑implementation survey.
Try It Yourself
<div style="display:flex; gap:10px; margin-top:10px;"> <a href="https://github.com/elqadiri/sql-data-warehouse" target="_blank"><button style="background:#24292e;color:#fff;padding:8px 16px;border:none;border-radius:4px;cursor:pointer;">View on GitHub</button></a> <a href="https://public.tableau.com/app/profile/hamza.el.qadiri/viz/SalesCustomerAnalyticsDashboardTableauProject/CustomerDash" target="_blank"><button style="background:#0066cc;color:#fff;padding:8px 16px;border:none;border-radius:4px;cursor:pointer;">Try it Live</button></a> </div>Conclusion & What’s Next
Building this dashboard proved that a well‑designed Tableau solution can replace dozens of ad‑hoc Excel reports while delivering faster, more reliable insights. The project sharpened my skills in data modeling, LOD calculations, and performance tuning—core competencies for any data‑centric engineering role.
Future enhancements include:
- Embedded AI‑driven recommendations (e.g., next‑best‑product suggestions) using Tableau’s integration with Python/R.
- Row‑level security for regional managers, ensuring each user sees only their territory’s data.
- Automated data pipeline with dbt and Airflow to keep the warehouse refreshed daily without manual intervention.
If you’re looking for a data‑visualization specialist who can turn chaotic sales logs into clear, impact‑focused dashboards, let’s connect. The code is open, the demo is live, and the next iteration is already on the roadmap.