HR Dashboards: Unlocking Insights for Strategic HR Management
 HR Dashboards
Introduction
In today's data-driven business landscape, Human Resources (HR) departments are no exception to the need for data-driven decision-making. The ability to analyze and interpret HR data is crucial for optimizing workforce management, improving employee satisfaction, and driving business success. This project addresses the need for a comprehensive HR dashboard, providing HR managers with a powerful tool to gain high-level insights and detailed employee records.
Key Features & Highlights
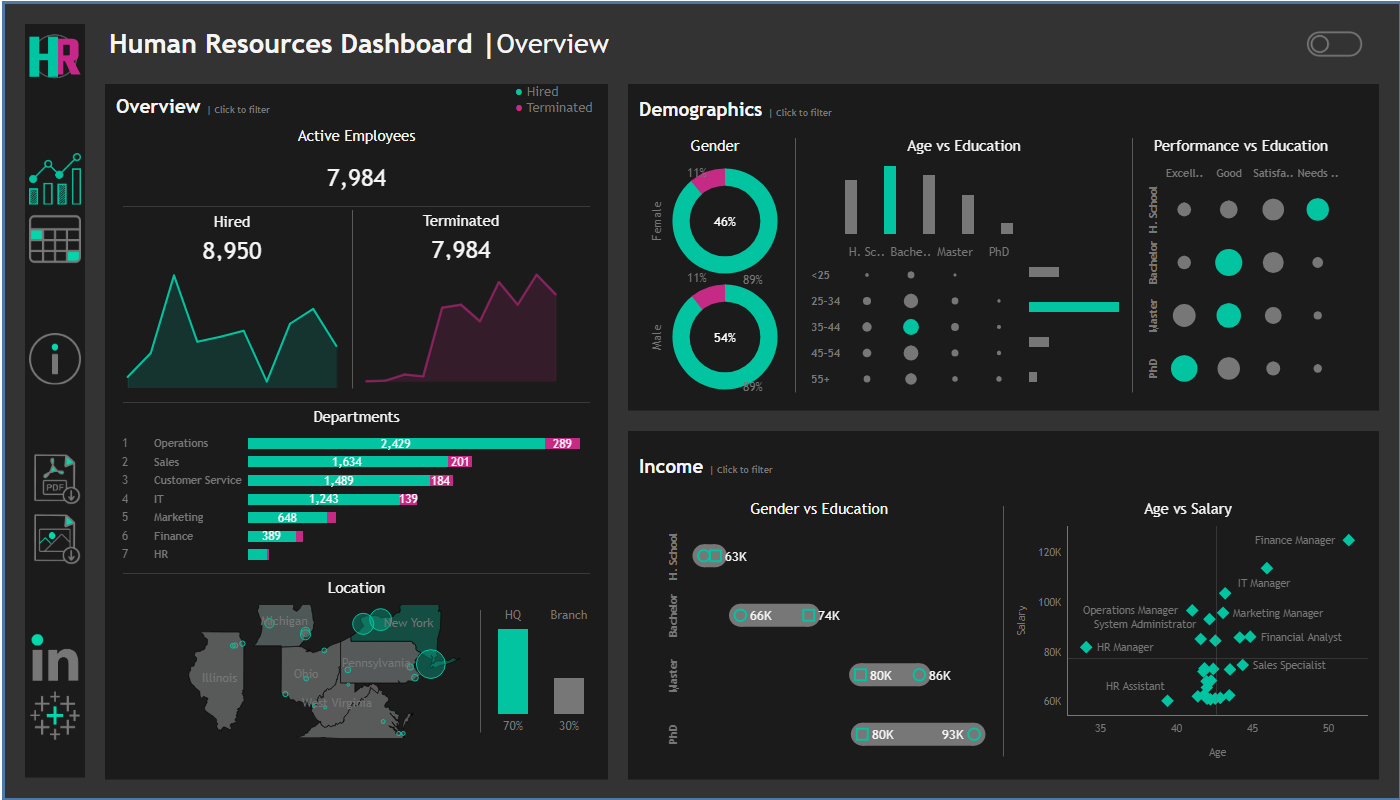
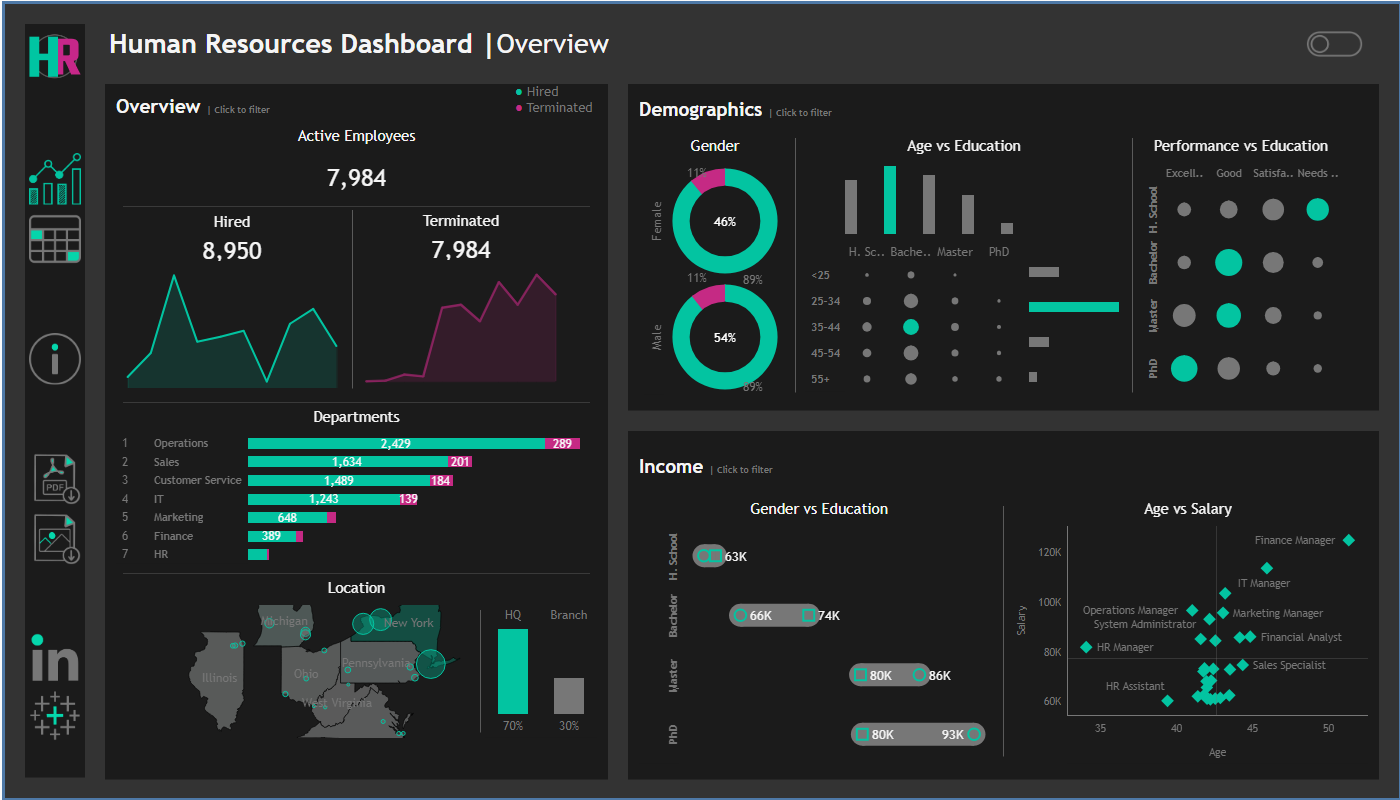
✅ Summary View: Overview, Demographics, and Income Analysis sections for a comprehensive understanding of HR metrics ✅ Interactive Visualizations: Dynamic charts and graphs to explore trends and patterns in HR data ✅ Employee Records View: Detailed list of employees with filtering capabilities ✅ Drill-Down Capabilities: Ability to dive deeper into specific data points for more detailed analysis
| Feature | Description |
|---|---|
| Overview | Snapshot of overall HR metrics, including total employees, department breakdown, and HQ vs. branches comparison |
| Demographics | Insights into workforce composition, including gender ratio, age distribution, and education level |
| Income Analysis | Salary-related metrics, including education level and age correlation |
Technical Architecture
The HR Dashboards project was built using Tableau, a powerful data visualization tool. The choice of Tableau was driven by its ability to connect to various data sources, create interactive dashboards, and provide a user-friendly interface for non-technical stakeholders.
| Component | Technology | Purpose |
|---|---|---|
| Data Visualization | Tableau | Create interactive and dynamic visualizations |
Tableau's strengths in data visualization and dashboard creation made it an ideal choice for this project. Its ability to connect to various data sources and handle large datasets ensured that the HR Dashboards could handle complex HR data.
Challenges & How They Were Overcome
One of the significant challenges faced during this project was data complexity. The HR data included various metrics, such as employee demographics, salary information, and performance ratings, which required careful handling to ensure accurate analysis.
To overcome this challenge, I employed data modeling techniques to structure the data in a way that facilitated analysis. I also utilized Tableau's data blending capabilities to combine multiple data sources into a single, cohesive view.
Another challenge was designing an intuitive and user-friendly interface. To address this, I applied user-centered design principles, ensuring that the dashboard was easy to navigate and provided clear insights into HR data.
Results & Impact
The HR Dashboards project has delivered a powerful tool for HR managers to analyze and interpret HR data. The interactive visualizations and detailed employee records have enabled HR teams to gain a deeper understanding of their workforce, making it easier to identify trends, patterns, and areas for improvement.
Try it Live
Try the HR Dashboards Live Demo
The live demo showcases the full capabilities of the HR Dashboards, allowing users to explore the data and gain insights into HR metrics.
Conclusion & What's Next
The HR Dashboards project has demonstrated the value of data-driven decision-making in HR management. By providing a comprehensive and interactive dashboard, HR teams can now make more informed decisions, driving business success and improving employee satisfaction.
Future improvements include expanding the data sources to include additional HR metrics and enhancing the dashboard's predictive analytics capabilities. By continuing to evolve and improve the HR Dashboards, we can further empower HR teams to drive business success.