Sales & Customer Dashboard: Unlocking Insights with Tableau
 Sales & Customer Dashboard
Introduction
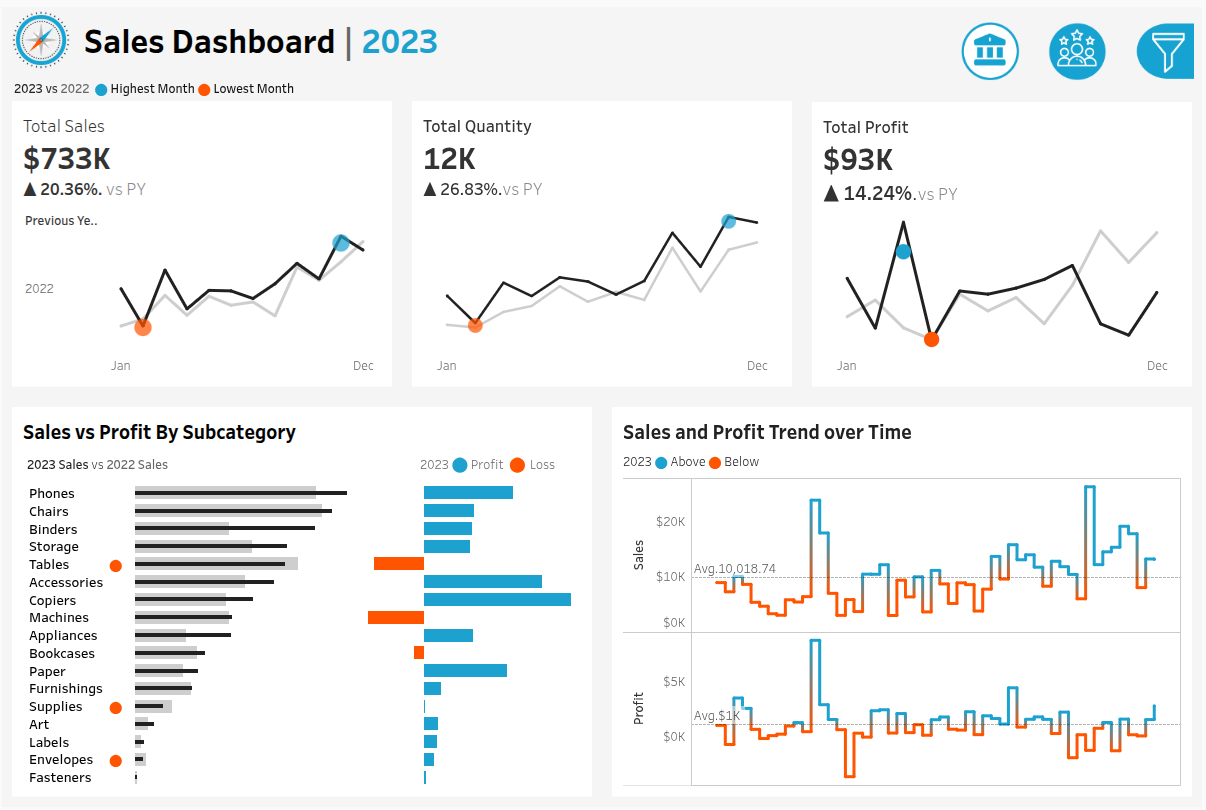
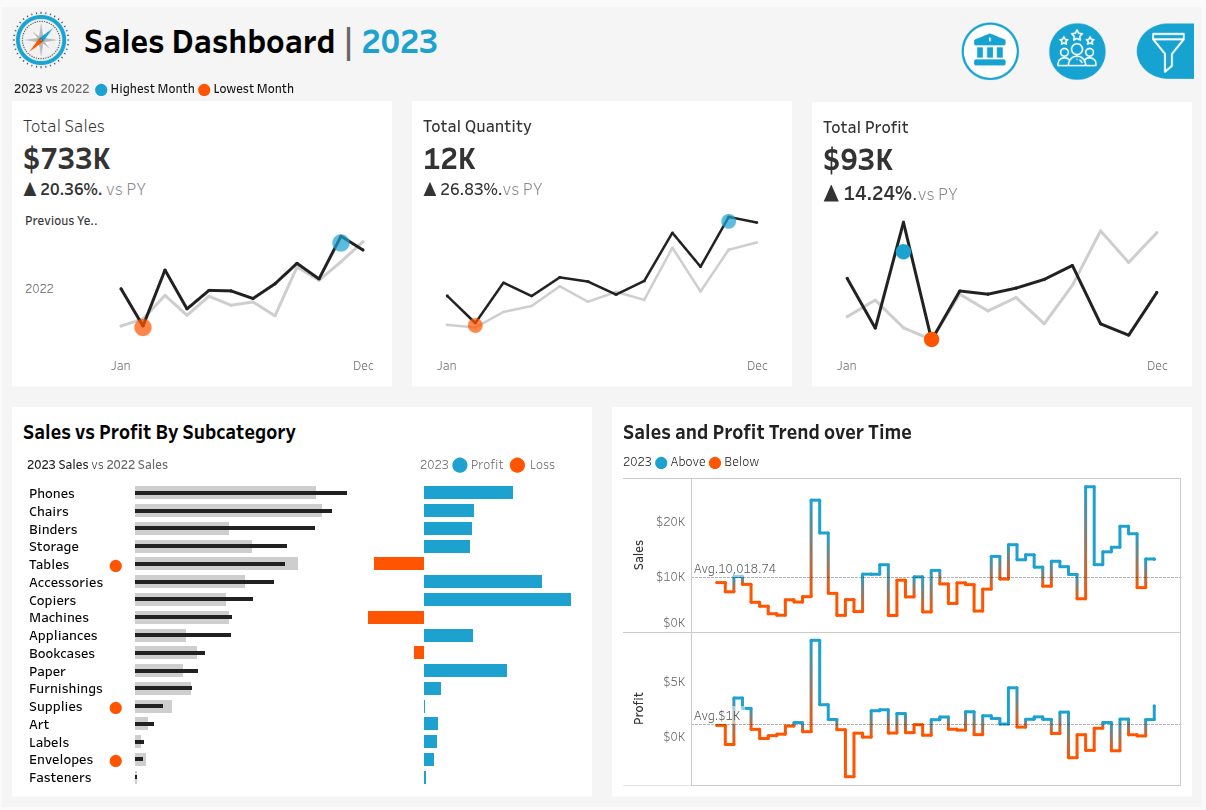
Analyzing sales performance and customer behavior is crucial for businesses to make informed decisions. The Sales & Customer Dashboard is designed to provide stakeholders with a comprehensive overview of sales metrics, trends, and customer insights. By leveraging Tableau's data visualization capabilities, this dashboard empowers sales managers, executives, and marketing teams to identify areas of improvement, optimize strategies, and drive growth.
Key Features & Highlights
✅ Interactive Dashboards: Sales and Customer Dashboards with dynamic filters and drill-down capabilities ✅ KPI Overview: Summary of key performance indicators, including total sales, profits, and customer metrics ✅ Trend Analysis: Monthly and weekly trend analysis for sales, profits, and customer behavior ✅ Comparative Analysis: Comparison of sales performance by product subcategory and customer distribution by number of orders ✅ Top Performers: Identification of top 10 customers by profit and their corresponding metrics
Technical Architecture
The Sales & Customer Dashboard is built using Tableau, a powerful data visualization platform. Tableau was chosen for its ability to connect to various data sources, create interactive dashboards, and provide a user-friendly interface. The tech stack can be summarized as follows:
| Component | Technology |
|---|---|
| Data Visualization | Tableau |
Tableau was selected for its strengths in data visualization, interactivity, and ease of use. Its ability to connect to various data sources and create dynamic dashboards makes it an ideal choice for this project.
Challenges & How They Were Overcome
One of the significant challenges faced during this project was data complexity. The dataset contained multiple tables, and creating a cohesive dashboard required careful data modeling and visualization. To overcome this, I employed data blending and data grouping techniques in Tableau to simplify the data and create meaningful visualizations.
Another challenge was designing an intuitive interface. To address this, I focused on creating a user-centered design, with clear and concise labels, and interactive elements that allow users to explore the data in-depth.
Results & Impact
The Sales & Customer Dashboard has delivered significant value to stakeholders by providing:
- Data-driven insights: Enabling sales managers and executives to make informed decisions based on sales trends and customer behavior
- Improved customer understanding: Allowing marketing teams to identify areas of improvement and optimize customer engagement strategies
- Enhanced decision-making: Empowering stakeholders to drill down into specific data points and explore the underlying trends
Try the live demo: https://public.tableau.com/app/profile/hamza.el.qadiri/viz/SalesCustomerDashboard_17722809275570/CustomerDashboard
Conclusion & What's Next
The Sales & Customer Dashboard demonstrates the power of data visualization in driving business insights. Future improvements include:
- Integrating additional data sources: To provide a more comprehensive view of customer behavior and sales performance
- Enhancing interactivity: By incorporating advanced filtering and drill-down capabilities
- Expanding to other business areas: To create a suite of dashboards that cater to various stakeholders and business needs
By continuing to iterate and refine the dashboard, we can unlock even more value for stakeholders and drive business growth.